

How the conversation around data centers evolved

Between 1 June and 14 September 2026 we identified 27K+ social media posts critical of the AI data-center buildout, drawn from roughly 170K relevant posts across twelve platforms. They generated 9.4 million interactions.
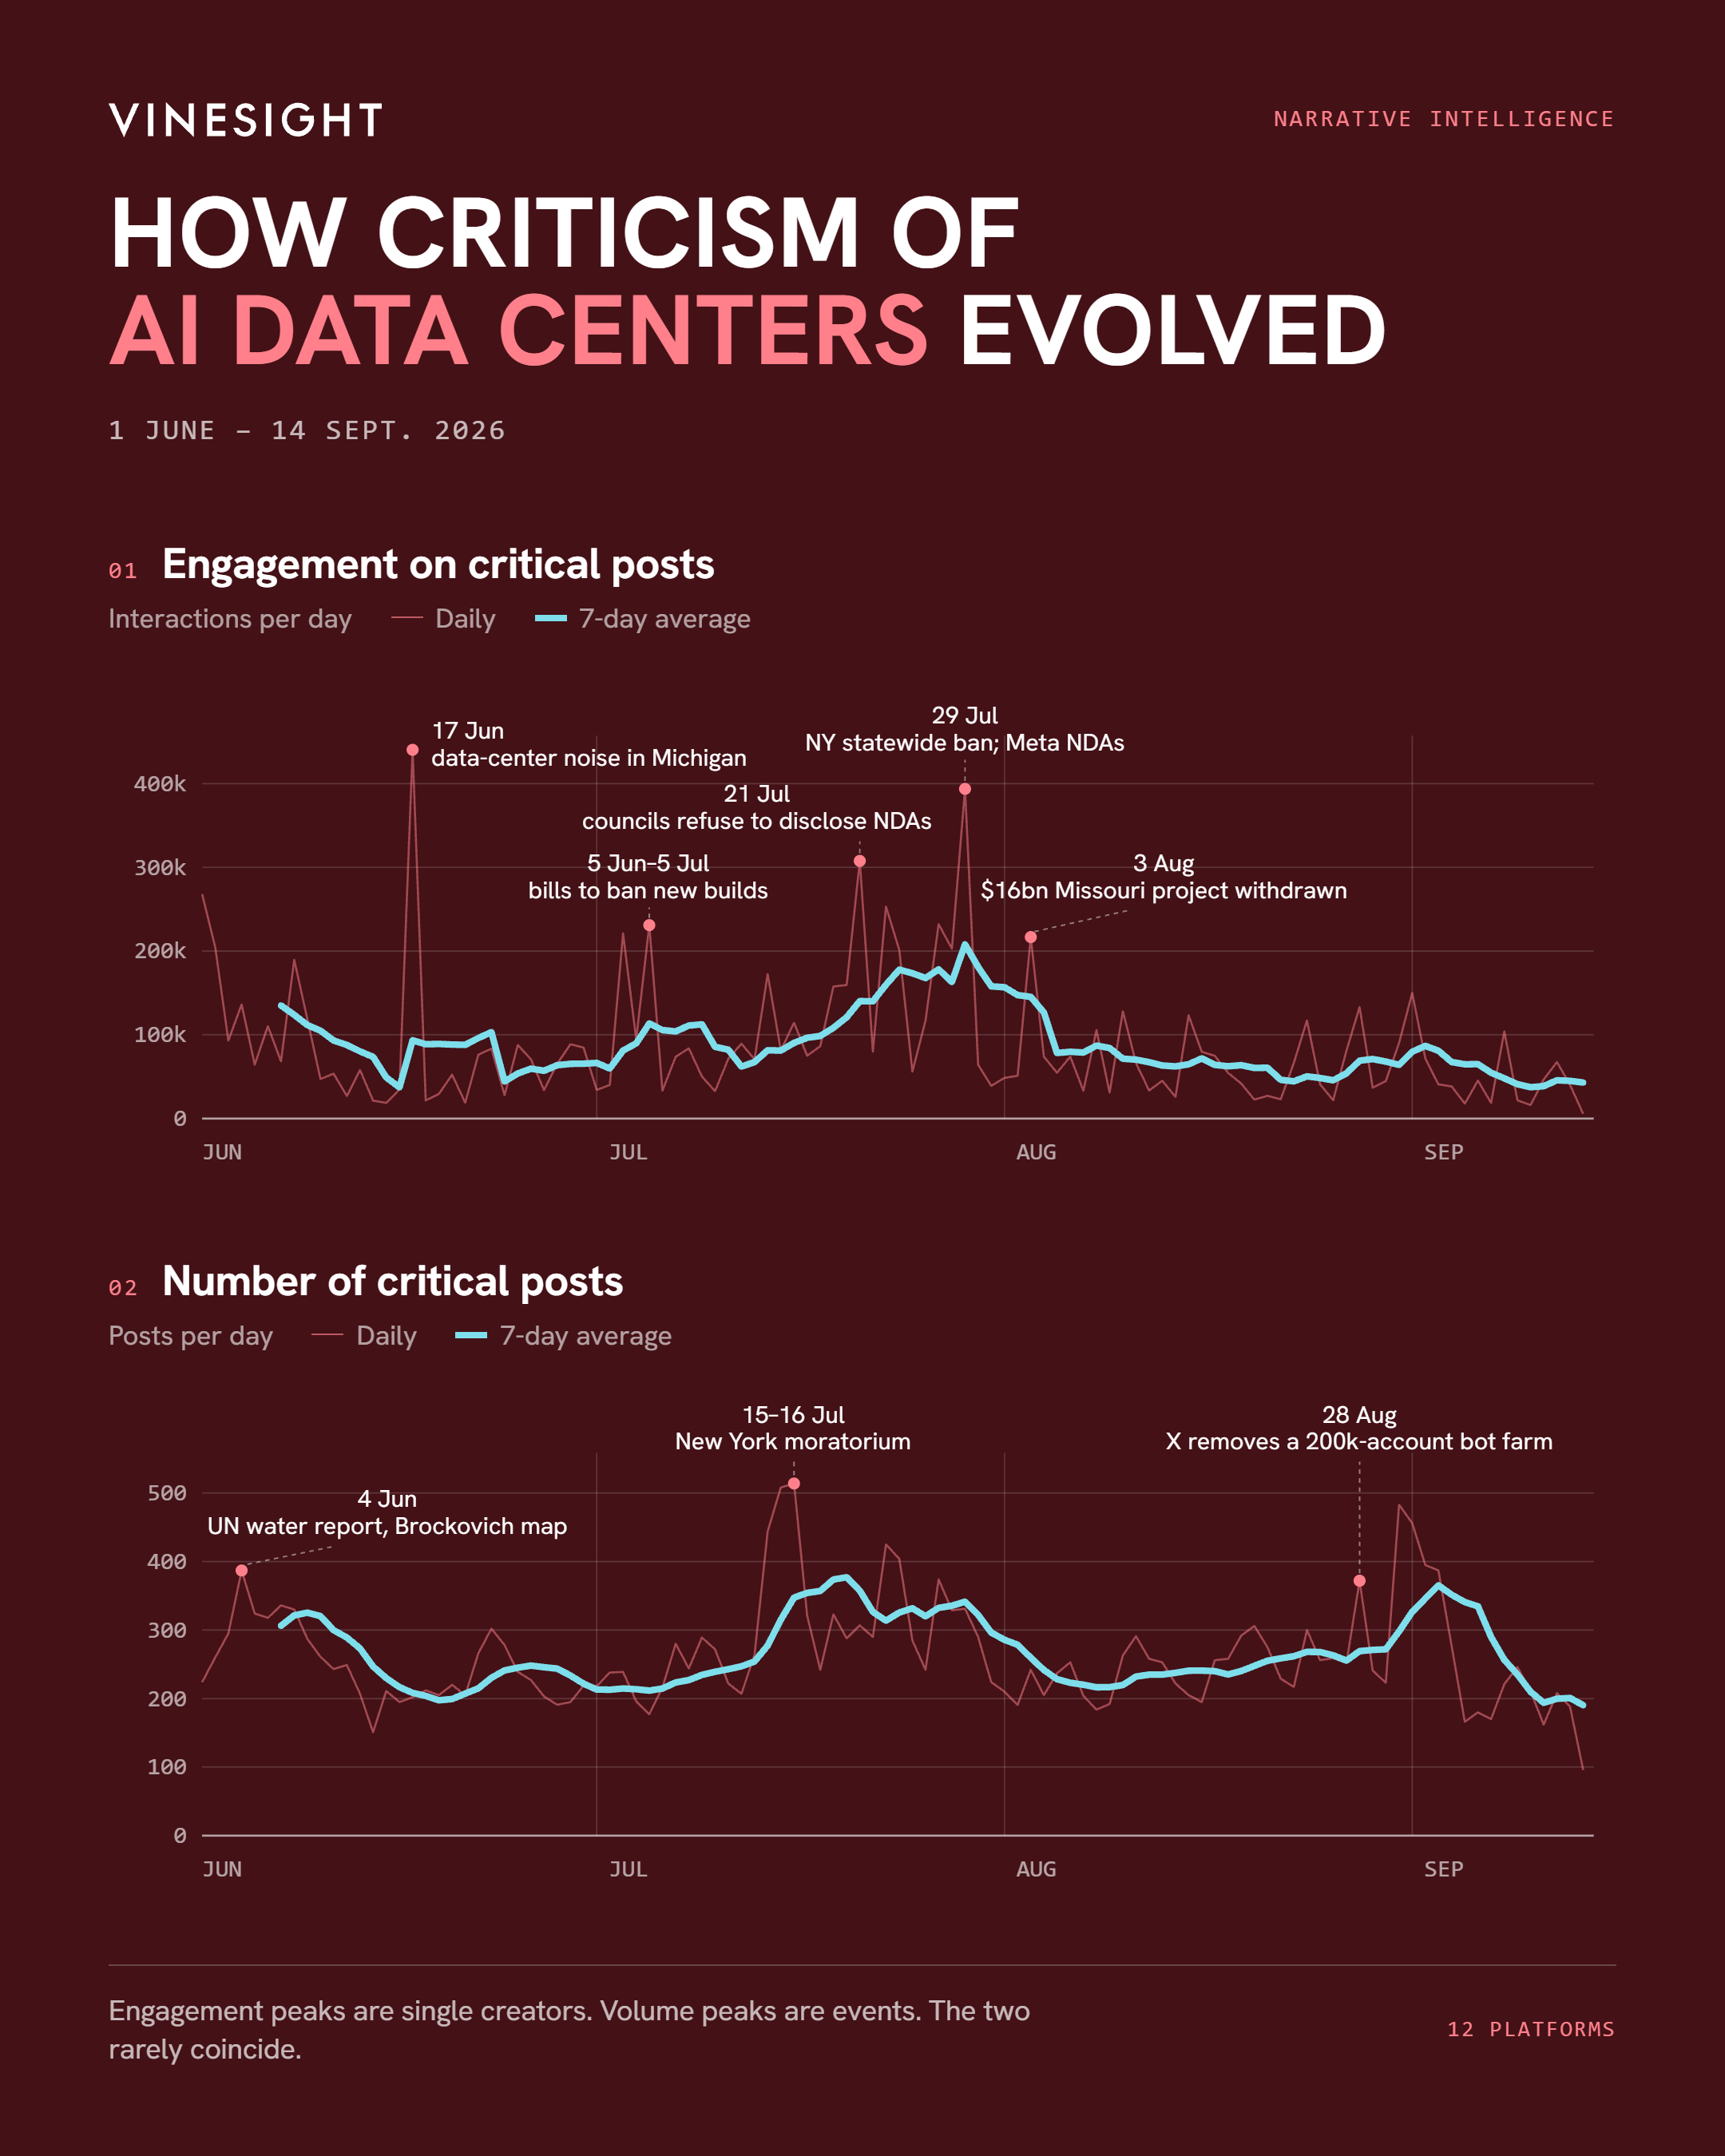
Engagement peaked in late July
The engagement curve is dominated by a handful of days, and almost every one of them is a single creator rather than a broad surge.
The largest, 17 June, drew 440,000 interactions — 287,000 of which came from one Instagram video: a recording of the acoustic noise from a 30-megawatt facility in Dowagiac, Michigan, reframed for an Australian audience. Noise travels further than any statistic.
29 July (394,000) followed the same pattern: one TikTok claiming data centers are "destroying our planet, our internet, and now our history" took 70% of the day. Underneath it sat New York's first statewide construction ban and the Meta–Louisiana story, in which officials signed non-disclosure agreements and rewrote legislation before public consultation.
21 July (308,000) belonged entirely to procedure — Michigan township officials refusing to say whether they had signed NDAs with developers. 5 July and 23 July were legislative, carrying two federal bills. 3 August (217,000) was the first victory spike: a $16 billion Missouri campus withdrawn after a packed community meeting.
After that, engagement falls away. The seven-day average peaks at 208,000 on 29 July and sits near 43,000 by mid-September, a decline of roughly 80%.
Volume peaked in early September
The volume chart does not agree. Critical posts per day peak on 16 July, but the seven-day average reaches its high in early September — six weeks after engagement topped out.
4 June was research-led: a UN-backed report on AI water consumption, a Harvard public-health analysis, and Erin Brockovich launching a national mapping tool for residents to log complaints.
15–16 July was New York's moratorium, plus an organised layer visible in the data itself — several near-identical posts circulating the same day, including one announcing 120 coordinated protests.
28 August is an anomaly. Its driver is not a grievance but a disclosure: X removed roughly 200,000 suspected Chinese inauthentic accounts, of which around 200 had been posting that US data centers raise household power bills. Fifteen near-identical copies of the announcement appeared that day.
31 August–3 September was political: Trump's remark that people who oppose data centers near them want to be "poor", AOC's reply proposing one at Mar-a-Lago.
What is actually being said
| Share of critical posts raising | Jun | Jul | Aug | Sep |
|---|---|---|---|---|
| Water use and drought | 26.5% | 20.9% | 21.1% | 22.5% |
| Bills, ratepayers, tax breaks | 13.8% | 18.7% | 17.4% | 14.8% |
| Pollution, health, noise | 18.4% | 16.4% | 15.5% | 15.3% |
| Grid strain | 5.3% | 6.0% | 6.2% | 4.4% |
| Bubble and financial risk | 6.5% | 8.3% | 9.9% | 9.5% |
| Secrecy and consent | 2.2% | 2.3% | 2.5% | 2.2% |
| Land and community | 6.7% | 6.9% | 6.9% | 6.5% |
| Organised opposition | 29.9% | 31.8% | 33.3% | 36.5% |
Three movements matter here.
The grievance shifted from resource harm to procedural harm. June belonged to water. By July the story was NDAs, secret negotiations and officials who would not answer questions. Water never left, but it stopped being sufficient.
The movement became its own subject. References to organised opposition climb steadily from 29.9% to 36.5% while every individual harm theme flattens. A growing share of critical content is about protests, moratoriums and council votes rather than about data centers. That is what a campaign looks like once it has structure.
Attention fell faster than activity. Fewer people amplifying, the same number still posting. The viral phase is ending; the organised phase is not. The second is slower, less visible, and considerably harder to counter.
Meanwhile a counter-narrative has formed: the buildout's defenders now argue that opposition is foreign-influenced, that the water claims are overblown, and (via the Ratepayer Protection Pledge) that costs can be capped.